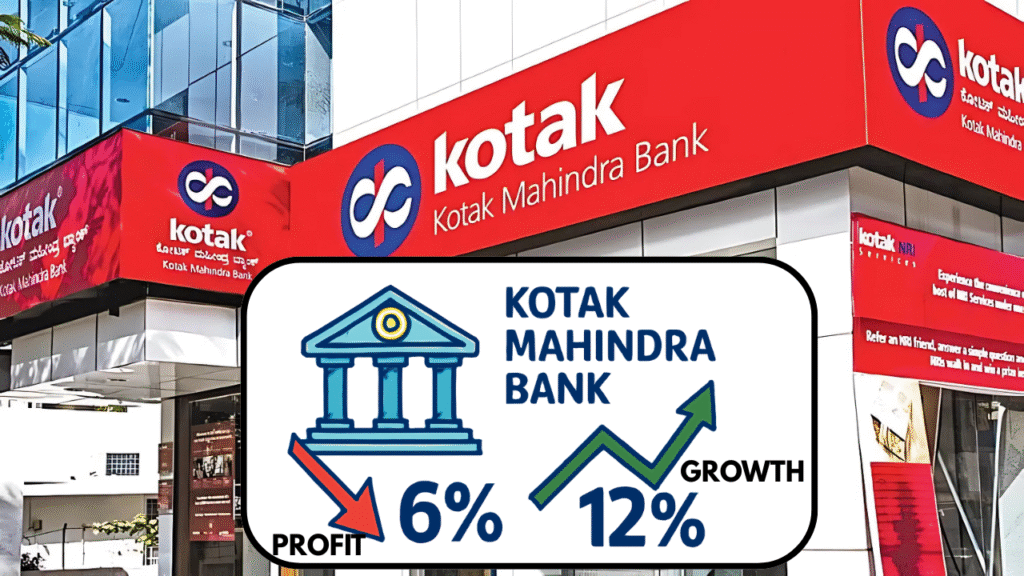
Kotak Mahindra Bank Q1 FY26 Results: What the 7% Profit Dip Really Means for Investors
Decoding the latest earnings, market impact, and what comes next for Kotak Mahindra Bank after its mixed quarterly show.
At a Glance: Q1 FY26 Financial Highlights
| Metric | Q1 FY26 | Q1 FY25 (Adj.) | YoY Change |
|---|---|---|---|
| Net Profit (PAT) | ₹3,282cr | ₹3,520cr | -7% |
| Net Interest Income (NII) | ₹7,259cr | ₹6,842cr | +6% |
| Net Interest Margin (NIM) | 4.65% | ~5.02% | -37bps |
| Average Advances | ₹4,44,823cr | ₹3,89,957cr | +14% |
| Total Deposits | ₹4,91,998cr | ₹4,35,603cr | +13% |
| Provisions & Contingencies | ₹1,208cr | ~₹578cr | +109% |
| Gross NPA Ratio | 1.48% | 1.39% | Higher |
| Return on Equity (ROE) | 10.94% | 13.91% | Lower |
Note: Q1 FY25 net profit is adjusted for a one-time insurance gain.
Kotak Mahindra Bank: Mixed Q1 FY26, But Growth Underneath
Kotak Mahindra Bank reported a 7% drop in net profit (PAT at ₹3,282cr) for Q1 FY26 against the same period last year (Q1 FY25 adj. ₹3,520cr). However, this decline came despite a 6% growth in Net Interest Income (NII) and double-digit expansion in both loans and deposits.
The profit contraction was largely due to a significant jump in provisions and contingencies (₹1,208cr, up 109% YoY) and a sharp fall in net interest margin (NIM) to 4.65% (from ~5% a year ago). Pressure on margins reflected a challenging interest rate environment and a changing loan mix.
On the positive side, advances grew 14% YoY and deposits rose 13%, signaling robust underlying business momentum. Notably, the decline in PAT was calculated after adjusting for a sizable one-off gain from a prior insurance business stake sale (which had artificially boosted Q1 FY25’s profit).
Key Takeaway:
Kotak remains a growth-focused bank—but the latest results expose short-term profitability pressures and shifting sector dynamics.
What Drove This Quarter’s Performance?
- Higher Provisions: The bank set aside significantly more for potential loan losses—provisions and contingencies jumped by 109% YoY, reflecting stress in microfinance, retail CV, and Kisan Credit Card segments.
- Net Interest Margin (NIM) Compression: NIM slipped 37bps to 4.65% as interest rates cut by the RBI were passed to borrowers faster than reductions in deposit rates, shrinking the bank’s profitability per loan rupee.
- Robust Credit Growth—but Mix Shifts: Loan book growth was led by corporates and secured retail; unsecured lending remained tepid. Much of the growth came from low-yielding products, impacting margin and fee income.
- Asset Quality Softens: Gross NPA edged up to 1.48% (from 1.39% YoY). Management cited industry-wide efforts to rein in unsecured lending, but stress pockets lingered in selected retail and CV portfolios.
- Return Metrics Fall: Return on equity (ROE) and return on assets (RoA) both declined, highlighting the impact of higher costs and provisions.
Did You Know?
More than 60% of Kotak’s loan book is now linked to external benchmark rates (repo-linked), speeding up margin changes as RBI policy shifts.
More than 60% of Kotak’s loan book is now linked to external benchmark rates (repo-linked), speeding up margin changes as RBI policy shifts.
Stock Market Reaction & Analyst Outlook
Kotak Mahindra Bank shares declined sharply (over 6% at one point) following Q1 results, mirroring market disappointment on profitability. Despite strong loan and deposit growth, the Street focused on margin compression and the surprise jump in provisions.
| Broker | Rating | Target Price | Key Concerns |
|---|---|---|---|
| Nomura | Neutral | ₹2,150 | Margin, asset quality |
| Morgan Stanley | Overweight | ₹2,600 | NIM dip, credit cost |
| Motilal Oswal | Buy | ₹2,400 | Unsecured growth rebound |
| Jefferies | Buy | ₹2,550 | Core numbers weak, margin support ahead |
| Bernstein | Market Perform | ₹1,950 | Valuation, credit cost bite |
Many brokerages trimmed earnings expectations for FY26–28 as margin pressure and credit cost normalization are likely to persist through the next quarter. However, most note that core franchise growth remains healthy, and a return to higher unsecured lending and stable margins in H2 could revive earnings.
- Valuation remains reasonable versus sector leaders (2.2x FY27E book as per consensus).
- Upside hinges on margin recovery and improved fee momentum.
Kotak Mahindra Bank vs Sector: How Does It Stack Up?
| Bank | NII Growth | Loan Growth | Profit Growth | Gross NPA | NIM | ROE |
|---|---|---|---|---|---|---|
| Kotak Mahindra | +6% | +14% | -7% (adj.) | 1.48% | 4.65% | 10.94% |
| ICICI Bank* | +12% | +16% | +4% | 1.42% | 4.78% | 14.8% |
| HDFC Bank* | +11% | +16% | +8% | 1.20% | 4.10% | 16.0% |
| Axis Bank* | +10% | +15% | +5% | 1.50% | 4.3% | 15.3% |
*Indicative recent metrics for comparable period
Kotak’s growth rates in loans and deposits compare well, but temporary pressure on profitability sets it apart from larger private peers who have managed NIMs and bottom lines better this quarter.
Kotak Mahindra Bank: YoY Growth in NII, PAT & Advances
NII and advances continue upward, but PAT reflects short-term margin/economic headwinds.
Frequently Asked Questions
Why did Kotak Mahindra Bank’s profit drop this quarter?
The main reasons were a sharp rise in provisions (up 109% YoY, to counterbalance asset quality pressures from retail, CV, and microfinance sectors) and a squeeze in net interest margin as lending rates dropped faster than deposit repricing, impacting bank profitability. Adjusting for the one-off insurance gain last year, the drop is less dramatic but still noteworthy.
Is the underlying growth story for Kotak Mahindra Bank intact?
Yes, strong double-digit growth in both loans (+14%) and deposits (+13%) show robust core business momentum. The current profit dip is more about margin resets and provisioning cycles than fundamental slowdown.
What is the current analyst sentiment on Kotak Bank stock?
Sentiment is mixed. Most brokerages have trimmed earnings forecasts and target prices but maintain at least a “hold” or “neutral” view, seeing limited downside with a potential margin and growth bounce-back in H2 FY26. Long-term investors are advised to monitor margin resilience and asset quality trends.
How does Kotak Mahindra Bank compare with peers?
Kotak lags larger private banks like ICICI and HDFC in immediate profit growth and margins this quarter. However, its balance sheet expansion and capital position remain strong, setting it up well if sector sentiment rebounds or interest margins recover.
You might like this SIP Strategy


Post Comment